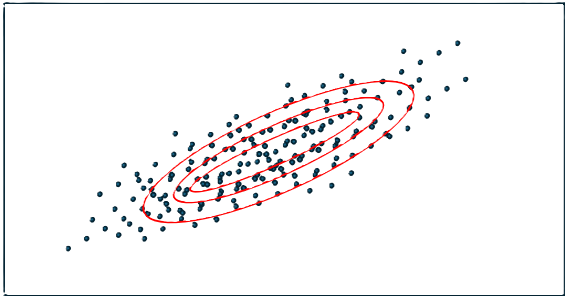
The covariance matrix has some unique properties that come from the fact that it is square and symmetric. This means that from a linear algebra perspective, it is a special matrix, and we could extract some interesting information from it. On the other hand, it is also a key intermediate step for numerous more complex statistical methods. Regardless of how sophisticated your method is, if you do not get the covariance matrix right, the final result will be questionable, to say the least.
The way you would calculate the covariance matrix for a multivariable structural dataset vs. a single univariate time series is subtly different. In this tutorial, we use two cases, representing both scenarios. The multivariable case uses a hypothetical set with 4 movies and 6 people who are ranking the movies, and the time series case uses real Oracle closing value data from the stock exchange.
The tutorial is structured to avoid complicated maths and to use Excel as a platform to explain and demonstrate everything you need to know about calculating the covariance matrix. The spreadsheets with all the calculations are placed here, and the paper containing the tutorial in PDF format can be downloaded or viewed from here.